Workplace Injuries and Fatalities: Statistics for Demographics, Timing, and Industries
Workplace injuries are something that we all strive to eliminate. Over the years, as regulations have been put in place, technological improvements have been made, and attitudes have changed, there have been vast improvements in workplace safety. However, as injuries and fatalities continue to occur, we can review the when, where, and who to help us better prevent these incidents.
When Do Injuries Occur?
For all workplace compensation claims, there is a steady downward trend as the week progresses, with the fewest incidents occurring on Thursdays and Fridays.

The authors of the 20 year study that produced this data hypothesized that this decrease through the week could be due to a gradual “readjustment” to the work environment following the weekend. This hypothesis was also supported by the fact that their data showed more workers compensation claims occurring in the mornings than in the afternoons. They offer the explanation of fatigue as the reason for the slight increase in incidents on Fridays. Another study found that there was an elevated risk of workplace injury in the mornings, night, or evenings, also supporting the idea that fatigue offsets the “normalisation” effect that lowers risk.
Electrical injuries follow a similar weekly trajectory, with an even more pronounced decline as the week progresses. The exception in this data is that Mondays also show a low incidence rate.
For electrical incidents, this low rate injury on Mondays may be due to a change in work behaviour. If Mondays are a typical “office day” for electrical workers, correspond with travel or job site orientation, or some other factor that decreases the likelihood that they are performing electrical work, this would mitigate the risk of electrical injury.


The hypothesis that the risk of workplace injury increases fatigue is also supported by the data on when in a shift an electrical injury occurred. Electrical injuries are more likely to occur as the shift progresses, with approximately 20% of all injuries occurring at 6-8 hours into a worker’s shift.
The drop-off in injury rate shown after the 8 hour mark is likely due to the decreased likelihood of working beyond 8 hours, as opposed to a decrease in risk associated with time worked after 8 hours.
Who is Getting Injured?
Anecdotally, many will say that the most likely to get hurt are those with the least experience. However, when looking at the data this does not hold true.
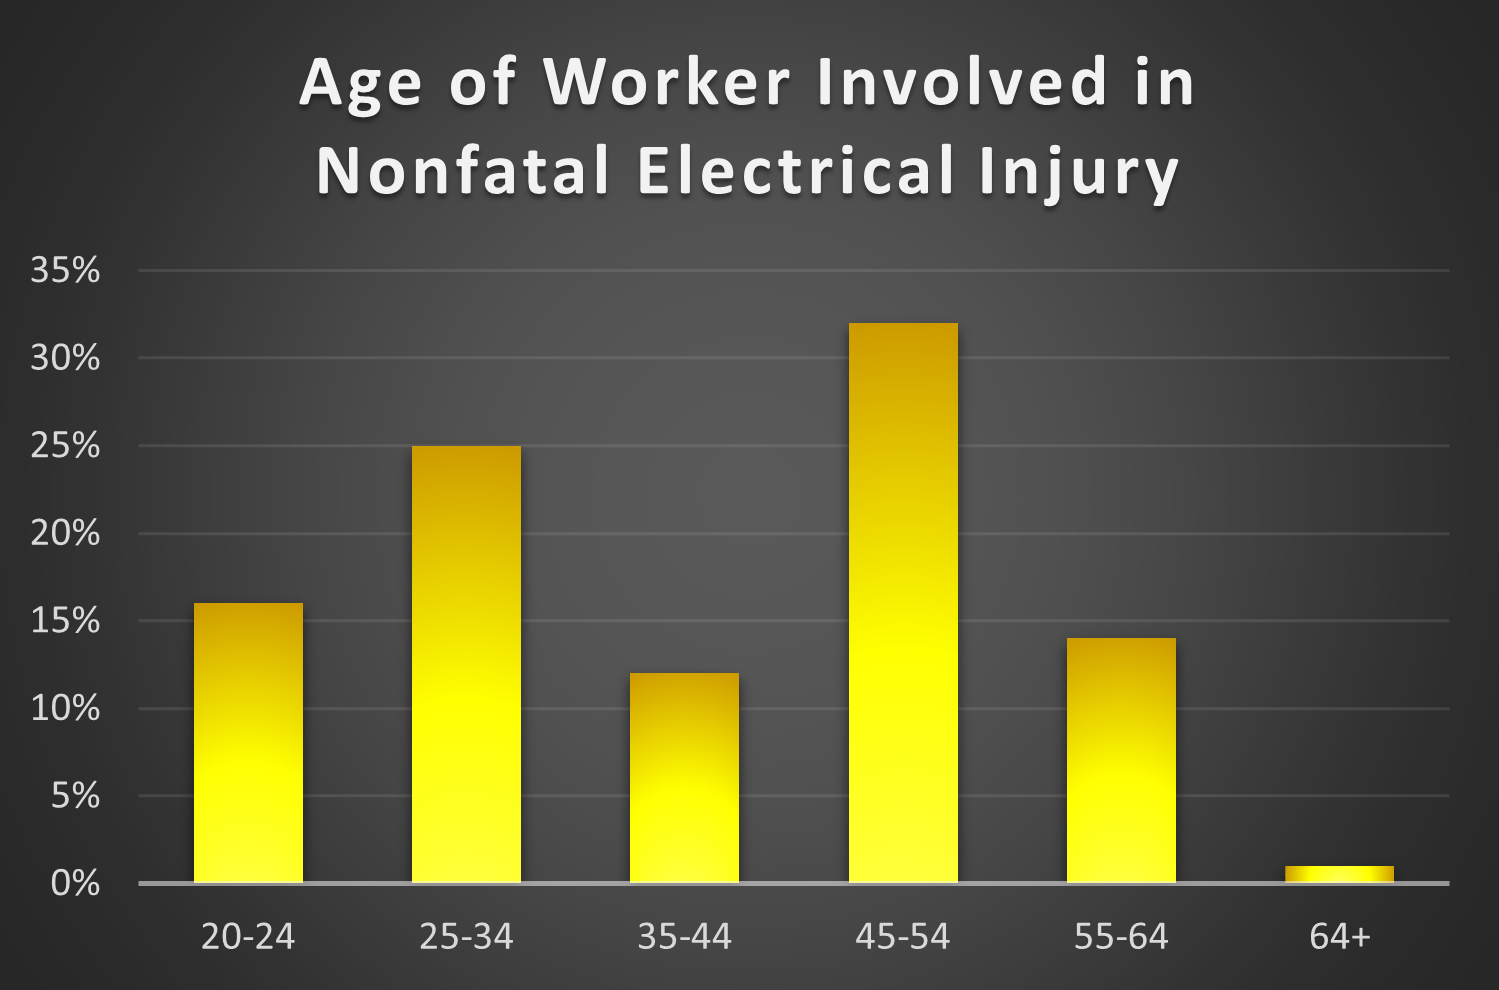
Workers in the 45-54 age bracket were the most likely to suffer a nonfatal electrical injury at 32%, with workers aged 25-34 accounting for 25% of nonfatal electrical injuries, and all other age brackets coming in under 20%.
Those in the 45-54 age range were also the most likely to require time off due to a workplace injury, at an occurrence rate of 10% higher than both the 24-34 and 35-44 age groups. The 45-54 age range also required the most time off of work, with a median of 12 days (compared to 8 and 6 days for 34-45 year olds and 25-34 year olds, respectively).
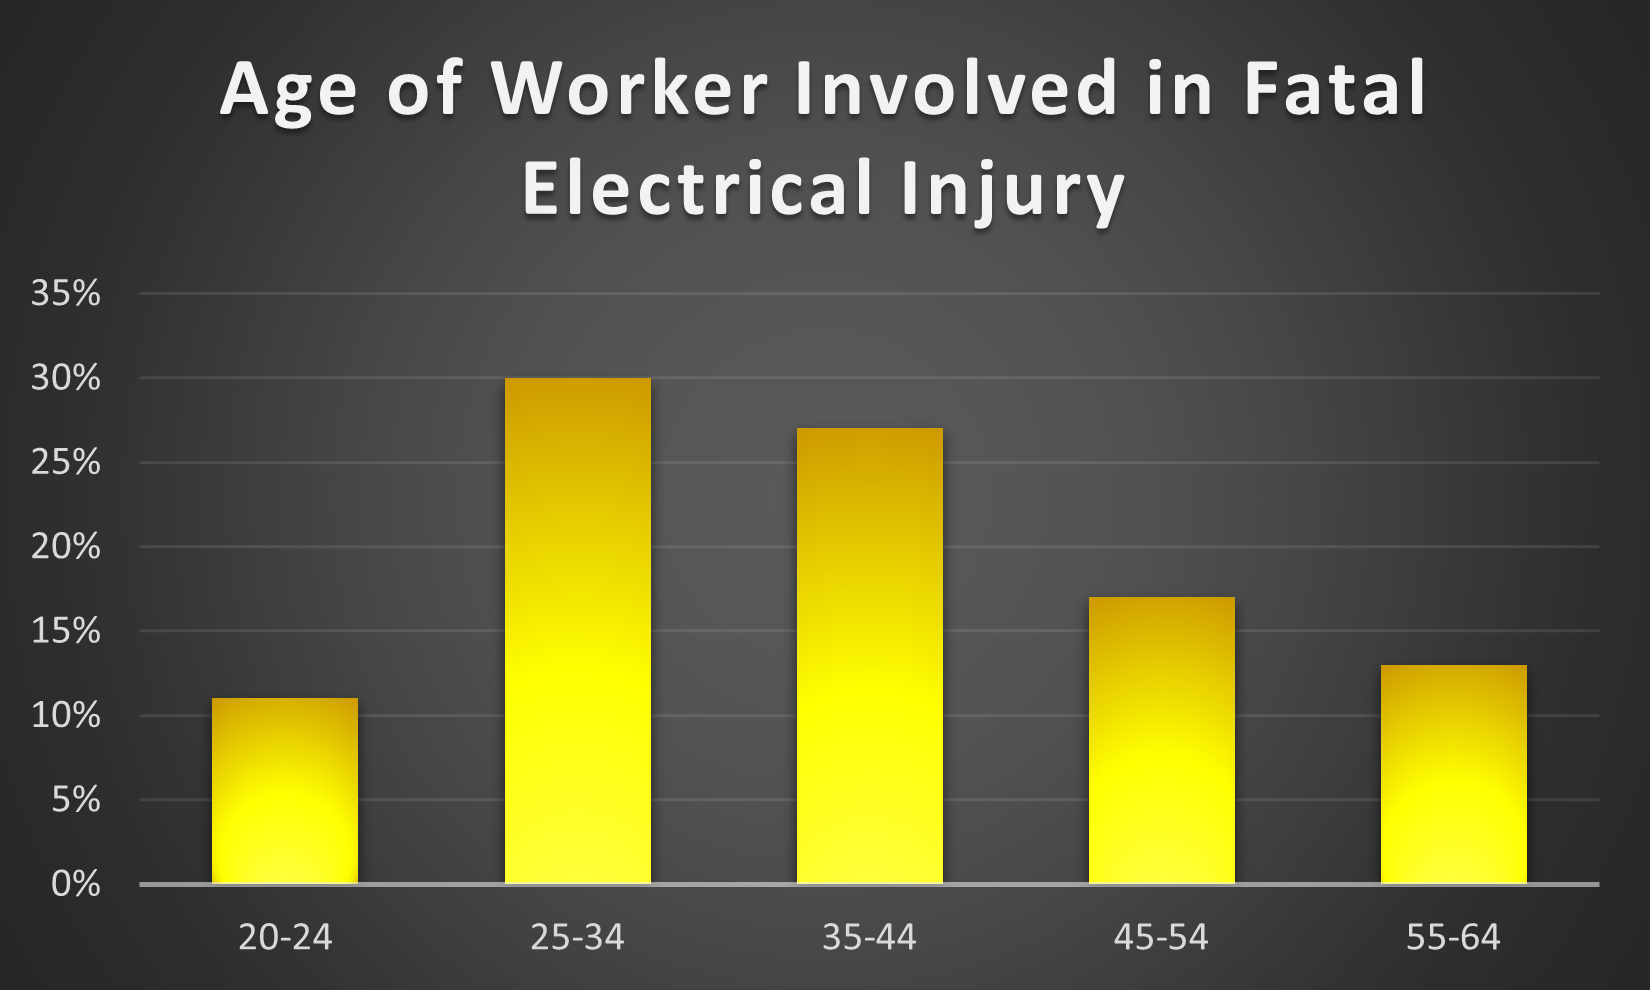
When looking at fatalities, there was a greater correlation with age (and assumed tenure) and likelihood of incident, with those in the 25-34 age range the most likely to be involved in an electrical fatality (30%), and likelihood decreasing with each subsequent age bracket.
Although there is some correlation between age (and assumed tenure) with injury or fatality, this data points to the need to improve safety among all workers, not just those who are newer to the industry. Experience can help prevent incidents, but it does not make more experienced workers immune to injury or death.
What Occupations Have The Most Injuries?
Data shows that 43% of the most dangerous jobs fall into the manufacturing and construction sectors. Some of the most dangerous jobs include:
Mining and quarrying worker
Construction workers
Pipefitters and commercial plumbing
Roofers
Structural iron and steelworkers
Electrical power line installers and repairers
For electrical incidents, similar industries see the most injuries and fatalities. Construction and extraction occupations accounted for the largest number of fatalities at 43%. Installation, maintenance, and repair came next, accounting for 22% of electrical fatalities, and building and grounds cleaning and maintenance occupations recorded 17% of electrical fatalities. A similar top three was seen for non-fatal electrical injuries, with installation, maintenance, and repair making up 35% of electrical injuries, construction and extraction accounting for 27%, and production recording 13% of electrical injuries. Workers performing tasks categorized as “Constructing, Repairing, Cleaning” accounted for electrical fatalities at 52%, and “Using or Operating Tools, Machinery” accounted for 27%.

All of this data, however, cannot be taken out of context. Additional factors need to be considered when reviewing the data. For example, women make up a much smaller percentage of trades workers than men, which is the industry in which injuries commonly occur - which explains why men are twice as likely to be injured than women.
As far as age goes, less than 7% of all workers are over the age of 65, workers in those age demographics are less present in the workplace, and therefore less likely to suffer from a workplace injury. Additionally, as most work that exposes workers to electrical risk requires certification, fewer 20-24 year olds are likely to be employed in those occupations.